Contents
CRFB2_Stevens_fun.m
Examine the concern that the ARLs are systematically biased because the exponent of the Stevens function for motion and texture differs from 1.
File: work/MLExper/CRFeedback2/analysis/CRFB2_Stevens_fun.m
Usage: publish('CRFB2_Stevens_fun.m','html') ;    % 'latex','doc','ppt'
Date: 2010-06-02
% 1.0.0 2010-06-02 AP: Wrote it
Get started
cd(fullfile(CRFeedback2_pathstr,'analysis')) ;
fprintf('\n\nCRFB2_Stevens_fun executed on %s.\n\n',datestr(now)) ;
fprintf('cd %s\n',pwd) ;

clear all ;
CRFB2_Stevens_fun executed on 02-Jun-2010 15:15:02.

cd /Users/apetrov/a/r/w/work/MLExper/CRFeedback2/analysis
Load the data
H_filename = fullfile(CRFeedback2_pathstr,'data','H.mat') ;
D_filename = fullfile(CRFeedback2_pathstr,'data','D.mat') ;

%recalculatep = true ;
recalculatep = false ;
if (recalculatep || ~exist(H_filename,'file'))
    if (recalculatep || ~exist(D_filename,'file'))
        %- Write down repository revision number
        fprintf('!/usr/local/bin/svn info \n') ;
        !/usr/local/bin/svn info

        %- Concatenate the individual data files into one master ASCII file
        fprintf('!cat sbj*.dat > raw_data.dat \n') ;
        !cat sbj*.dat > raw_data.dat

        %- Import the ASCII data files to Matlab
        fprintf('\nD=CRFB2_import_data ...') ;
        g = fullfile(CRFeedback2_pathstr,'data','raw_data.dat') ;
        D = CRFB2_import_data(g,[],P) ;
        %- Save D for future use
        save(D_filename,'D') ;
        fprintf('\nsave %s \n',D_filename) ;
    else
        fprintf('load %s \n',D_filename) ;
        load(D_filename) ;
    end
    assert(exist('D','var')==1) ;

    %- Calculate the average response levels
    fprintf('\nH = CRFB2_data_by_sbj(D) ...\n') ;
    [H,P,ARL_params] = CRFB2_data_by_sbj(D,1,P) ;
    %- Save H for future use
    save(H_filename,'H') ;
    fprintf('\nsave %s \n\n',H_filename) ;
else
    fprintf('load %s \n\n',H_filename) ;
    load(H_filename) ;
end
assert(exist('H','var')==1) ;

N_trials = 350 ;   % per stimulus type
N_sbj = length(H) ;
load /Users/apetrov/a/r/w/work/MLExper/CRFeedback2/data/H.mat
Isolate the MOTION stimulus-response pairs
S_mot = zeros(N_trials,N_sbj) ;
R_mot = zeros(size(S_mot)) ;
for k=1:N_sbj
    S_mot(:,k) = H(k).MOTION_data(:,4) ;   % categ == fdbk
    R_mot(:,k) = H(k).MOTION_data(:,7) ;   % resp
end

xtab2(S_mot(:),R_mot(:))
         |     1     2     3     4     5     6     7 | Total Percent
---------+-------------------------------------------+--------------
       1 |  1014   605   289   106    61     8     3 |  2086    14.5
       2 |   443   638   542   298   123    27     3 |  2074    14.5
       3 |   121   379   552   581   317    99    13 |  2062    14.4
       4 |    33   143   409   601   499   295    70 |  2050    14.3
       5 |     8    60   175   418   607   481   289 |  2038    14.2
       6 |     5    13    75   226   397   649   661 |  2026    14.1
       7 |     3     5    19    76   233   517  1161 |  2014    14.0
---------+-------------------------------------------+--------------
 Total   |  1627  1843  2061  2306  2237  2076  2200 | 14350
 Percent |  11.3  12.8  14.4  16.1  15.6  14.5  15.3 |         100.0
Isolate the TEXTURE stimulus-response pairs
S_txt = zeros(N_trials,N_sbj) ;
R_txt = zeros(size(S_mot)) ;
for k=1:N_sbj
    S_txt(:,k) = H(k).TEXTURE_data(:,4) ;   % categ == fdbk
    R_txt(:,k) = H(k).TEXTURE_data(:,7) ;   % resp
end

xtab2(S_txt(:),R_txt(:))
         |     1     2     3     4     5     6     7 | Total Percent
---------+-------------------------------------------+--------------
       1 |  1829   171     8     3     2           1 |  2014    14.0
       2 |   635  1159   191    26    12     1     2 |  2026    14.1
       3 |   162   662   905   243    52    11     3 |  2038    14.2
       4 |    44   223   708   746   258    65     6 |  2050    14.3
       5 |    13    60   260   595   790   300    44 |  2062    14.4
       6 |     5     1    45   193   544   949   337 |  2074    14.5
       7 |     3     2     4    34   104   360  1579 |  2086    14.5
---------+-------------------------------------------+--------------
 Total   |  2691  2278  2121  1840  1762  1686  1972 | 14350
 Percent |  18.8  15.9  14.8  12.8  12.3  11.7  13.7 |         100.0
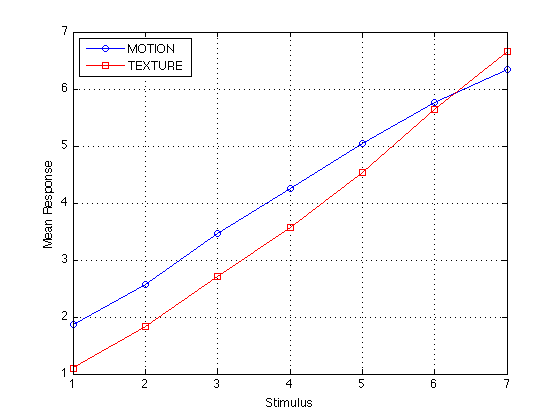
Stevens functions
[s,S] = split(R_mot(:),S_mot(:)) ;
mR_mot = aggreg(s) ;

s = split(R_txt(:),S_txt(:)) ;
mR_txt = aggreg(s) ;

plot(S,mR_mot,'bo-',S,mR_txt,'rs-') ;
grid on
legend('MOTION','TEXTURE','location','NorthWest') ;
xlabel('Stimulus') ;  ylabel('Mean Response') ;
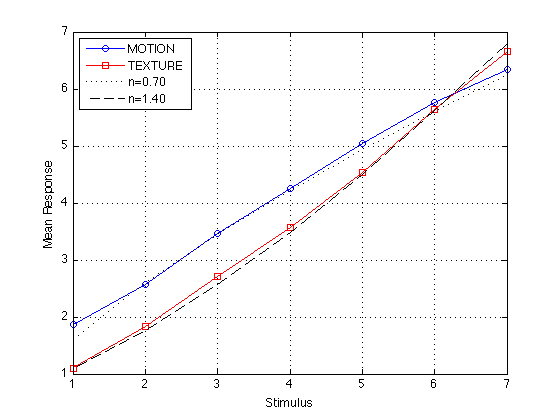
Correlations:
R070 = 1.6*S.^0.70 ;       % n=0.70 -- arbitrarily chosen, not fit to data
R140 = .7+(S.^1.4)./2.5 ;  % n=1.40 -- arbitrarily chosen, not fit to data

corrcoef([S mR_mot mR_txt R070 R140])

plot(S,mR_mot,'bo-',S,mR_txt,'rs-',S,R070,'k:',S,R140,'k--') ;
grid on
legend('MOTION','TEXTURE','n=0.70','n=1.40','location','NorthWest') ;
xlabel('Stimulus') ;  ylabel('Mean Response') ;
ans =

    1.0000    0.9987    0.9980    0.9970    0.9956
    0.9987    1.0000    0.9946    0.9982    0.9909
    0.9980    0.9946    1.0000    0.9902    0.9994
    0.9970    0.9982    0.9902    1.0000    0.9854
    0.9956    0.9909    0.9994    0.9854    1.0000
Clean up
clear k s
Conclusion:
Even if the Stevens function is not linear, it is locally linear. The nonlinearity is negligible for the purposes of calculating the ARL. The correlation between the mean response (conditional on the stimuli) and the categories 1-7 is >.998 for both MOTION and TEXTURE.
% 2010-06-02