SUSTAIN predictions for the fdbk1 experiment
Brad Love (personal communication, 2008-04-30) explained that, with external feedback, SUSTAIN will make new clusters only in regions where the perceptual distributions of the seven stimuli overlap. Most errors will be blamed on the decision mechanism and thus will not be counted as "surprises". Only perceptual overlap counts as genuine "surprise".
This script makes a quick-and-dirty pass at determining how much perceptual overlap there is in our stimuli, under the standard ANCHOR assumption that the perceptual noise kp=.04
File: work/CMUExper/fdbk1/data/SUSTAIN_overlap.m
Date: 2008-06-15
Alexander Petrov, http://alexpetrov.com
Contents
Magnitude continuum
Ignore pixels and such. Just work with 1, 2, 3, ..., 7
m=[0:.02:8]' ;
kp = .04 ;
N_stimuli = 7 ;
S = 1:N_stimuli ;        % means of the 7 stimulus distributions
sd = S.*kp ;     % std deviations -- see ANCHOR's perceptual equation
Probability density
d = zeros(length(m),N_stimuli) ;
for s = 1:N_stimuli
    d(:,s) = normpdf(m,S(s),sd(s)) ;
end
plot(m,d) ;
xlabel('Magnitude') ; ylabel('Probability density') ; grid on ;
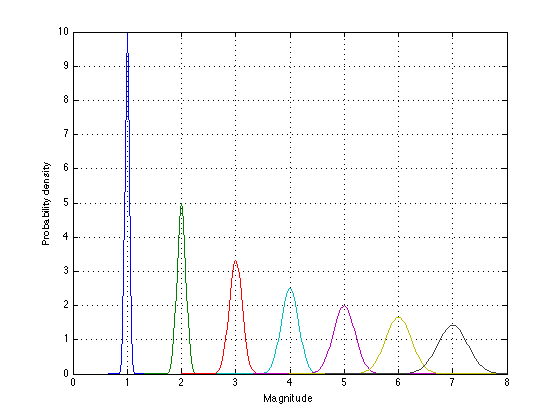
Important observation
Due to Weber's law, there is much more overlap at the high end of the scale than at the low end. In fact, there is hardly any overlap at the low end.
Approximate break-even points
To quantify this, we need to find the break-even points between consecutive perceptual distributions S_{i} and S_{i+1}. The break-even point C_{i} is approximately located at:
Si = S(1:N_stimuli-1) ;
Si1 = S(2:N_stimuli) ;
Ci = 2.*(Si.*Si1)./(Si+Si1) ;

height=zeros(2,N_stimuli-1) ;
for s=1:N_stimuli-1
    height(1,s) = normpdf(Ci(s),S(s),sd(s)) ;
    height(2,s) = normpdf(Ci(s),S(s+1),sd(s+1)) ;
end
height
height =
    0.0000    0.0000    0.0056    0.0526    0.1507    0.2616
    0.0000    0.0000    0.0042    0.0421    0.1256    0.2242
Corrected break-even points
The two heights aren't quite equal, so we move the criteria to the right:
Ci = Ci + .01 ;
height=zeros(2,N_stimuli-1) ;
for s=1:N_stimuli-1
    height(1,s) = normpdf(Ci(s),S(s),sd(s)) ;
    height(2,s) = normpdf(Ci(s),S(s+1),sd(s+1)) ;
end
height
height =
    0.0000    0.0000    0.0042    0.0442    0.1344    0.2412
    0.0000    0.0000    0.0053    0.0483    0.1380    0.2400
Area overlap
The two heights are now approximately equal, so let's calculate the area on the "wrong" side of each criterion
overlap = zeros(2,N_stimuli-1) ;
for s=1:N_stimuli - 1
    overlap(1,s) = 1-normcdf(Ci(s),S(s),sd(s)) ;    % right tail of S_{i}
    overlap(2,s) = normcdf(Ci(s),S(s+1),sd(s+1)) ;  % left tail of S_{i+1}
end
overlap
overlap =
         0    0.0000    0.0001    0.0023    0.0101    0.0247
    0.0000    0.0000    0.0002    0.0032    0.0128    0.0296
Confusability per trial
There is approx 5% chance per trial that SUSTAIN will be "surprised" between S6 and S7, 2% chance to be "surprised" between S5 and S6, .5% chance to be "surprised" between S4 and S5, and negligible chance to be "surprised" b/n S1 and S2:
p = sum(overlap) ;
disp(p.*100) ;
0.0000 0.0001 0.0354 0.5442 2.2935 5.4278
Confusability per block
WARNING: This dangerously magnifies the error of our quick-and-dirty approximation above. Interpret with a huge grain of salt! In a High block, there will be 7 presentations of S7 and 6 presentations of S6. Thus there are 13 opportunities to be "surprised" b/n S6 and S7:
N_opportunities = Si+Si1 ;                     % per block
P(1,:) = 1 - (1-p).^N_opportunities ;          % in High context
P(2,:) = 1 - (1-p).^fliplr(N_opportunities) ;  % in Low context
disp(P.*100) ;
    0.0000    0.0003    0.2473    4.7924   22.5260   51.5909
    0.0000    0.0006    0.3179    3.7477   10.9536   15.4155
Conclusions
- In Low context (when S1 is most frequent), SUSTAIN emulates a pure prototype mode in that it will not be "surprised" and hence will maintain only one cluster per category.
- In High context (when S7 is most frequent), SUSTAIN emulates INST in that it will be "surprised" often (5% per each persentation of S6/S7, 50% per block). This will seed the memory with multiple clusters for the high (and frequent) categories, which in turn will defeat the compensatory tendency of the location learning in SUSTAIN (which is based on the delta rule, exactly like ANCHOR's).
- Regardless of context, SUSTAIN predicts a compensatory tendency for stimuli at the low end of the continuum and an assimilatory tendency for stimuli at the high end of the continuum! This can be tested in our data by comparing the response frequencies for S2 and S6. The tendency that all ARLs tend to drift upwards in our data seems consistent with this prediction.
- In particular, SUSTAIN predicts that in the Low context, the compensation effects without feedback can be no greater than the compensation effects with feedback. This is because in this region of the continuum, there are virtually no perceptual "surprises". This prediction is clearly violated in our data.
- Last but not least, SUSTAIN predicts that the compensatory tendency should diminish steadily with practice, as "surprises" accumulate.
It should be emphasized once again that all this applies for the feedback blocks only! Without feedback, SUSTAIN's surprises depend on the threshold parameter tau in Equation 11 in LoveMedinGureckis04.
2008-06-15