can_INST_compensate.m
Are there parameter regimes in which the instance-based model "INST" (implemented in work/models/protoanchor.m) exhibits less assimilation without feedback that it does with feedback under skewed stimulus distributions?
The tendency off all responses to drift upwards without feedback is eliminated in order to see the context-induced effects more clearly.
File: work/models/protoanchor/can_INST_compensate.m
Date: 2007-06-05
Alexander Petrov, http://alexpetrov.com
Contents
- Make a test bank of stimulus sequences
- Parameters for the INST model
- Run the model and calculate ARL profiles
- Plot the group ARLs for the INST model
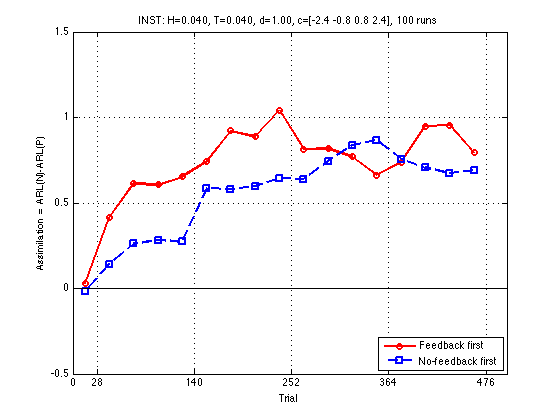
- Define Assimilation := ARL(N)-ARL(P)
- Collapse across blocks and print report
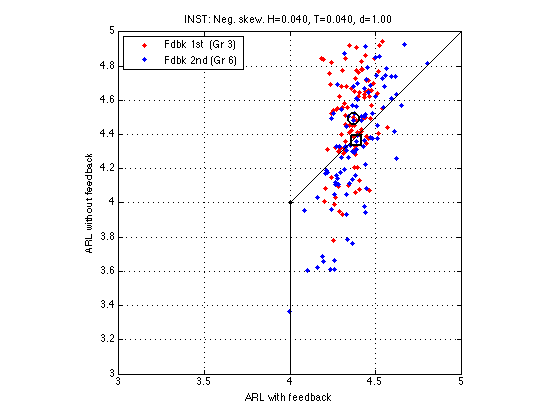
- Scatterplot for the Negative groups 3 & 6. INST model
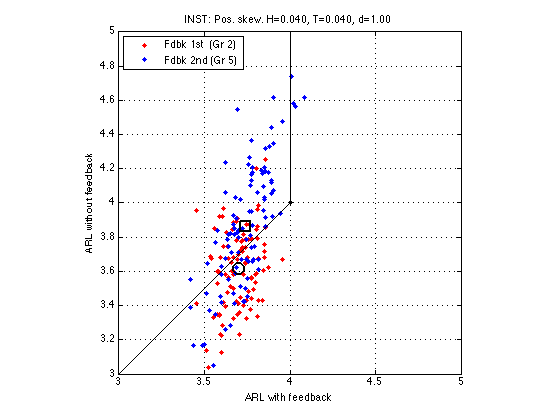
- Scatterplot for the Positive groups 2 & 5. INST model
Make a test bank of stimulus sequences
- Gr1 -- Uniform (not skewed), feedback first. Should be no assimilation
- Gr2 -- Positively skewed, feedback first. Assimilation decreases ARL
- Gr3 -- Negatively skewed, feedback first. Assimilation increases ARL
- Gr4 -- Uniform (not skewed), feedback second. Should be no assimilation
- Gr5 -- Positively skewed, feedback second. Assimilation decreases ARL
- Gr6 -- Negatively skewed, feedback second. Assimilation increases ARL
Parameters for the INST model
iP =
        scale: 'LINEAR'
        N_cat: 7
      SM_conv: 1.0000e-03
       cat_sz: 0.0400
       perc_k: 0.0400
        mem_k: 0.0700
        avail: [7x1 double]
    instances: [7x3 double]
      cutoffs: [-2.4000 -0.8000 0.8000 2.4000]
       temper: 0.0400
      history: 0.0400
        alpha: 0.3000
        decay: 1
          ITI: 4
Run the model and calculate ARL profiles
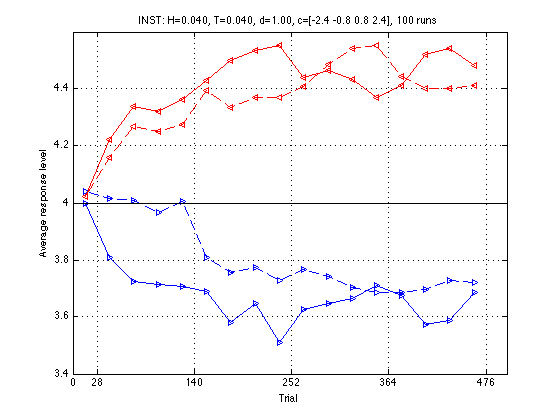
Plot the group ARLs for the INST model
See CMUExper/fdbk1/data/model_ARL_scplot.m

Define Assimilation := ARL(N)-ARL(P)
See CMUExper/fdbk1/data/assimil_profiles.m
- 1 = Feedback first = Group 3 - Group 2
- 2 = No-feedback first = Group 6 - Group 5

Collapse across blocks and print report
Params: H=0.040, T=0.040, d=1.00, c=[-2.4 -0.8 0.8 2.4], 100 runs
-----------------------------------------------------------------
Red line:  fdbk1 = +0.67, nofb1 = +0.88, f-n = -0.21   % fdbk 1st
Blue line: nofb2 = +0.51, fdbk2 = +0.65, f-n = +0.15   % nofb 1st
Interactn: first = +0.16, secnd = -0.22, TTL = -0.06
Scatterplot for the Negative groups 3 & 6. INST model
For Negatively skewed stimuli, higher ARLs indicate assimilation and lower ARLs indicate compensation.

Scatterplot for the Positive groups 2 & 5. INST model
For Negatively skewed stimuli, higher ARLs indicate assimilation and lower ARLs indicate compensation.
